-
 Hook
the students with the question "Which of you are Golden Students?" Hook
the students with the question "Which of you are Golden Students?"
-
Show the video Donald Duck In Mathmagic Land
up to the point where Donald is trying to fit into the golden rectangle.
-
Explain that as the students observed from
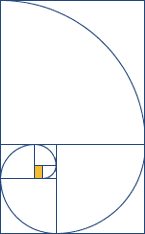
the video, there are many things in nature which have proportions of the
golden ratio. Divide students into cooperative groups to collect data from
body measurements to form ratios. Students will analyze these ratios to
determine which student is the closest to being golden.
-
When they have completed all measurements,
direct students to convert these ratios into their equivalent decimal forms
using the calculator. Round to the nearest thousandth.
-
Tell your class that the golden ratio is equivalent
to 1.618. As a class, decide a reasonable range of golden (i.e.: 1.568
to 1.668). Have the students circle the ratios on their lists which are
golden.
-
Decide as a class, which student(s) are golden.
This is usually the person with the most ratios circled by his or her name.
-
Continue the lesson by having the students
make a class histogram/bar graph of a body ratio.
-
 Have
the groups collect ratios from all of the students and make a large class
histogram using the poster board and markers. Discuss the characteristics
of a good graph such as title, axis names, and scales. Have
the groups collect ratios from all of the students and make a large class
histogram using the poster board and markers. Discuss the characteristics
of a good graph such as title, axis names, and scales.
-
Have students present their poster board in
front of the class or display the poster boards around the room.
-
Summarize the activity by revisiting ratios,
equivalent forms, and the golden ratio.
-
An added enhancement would be to show the
pictures of various items that might be golden.
-
Reward the class by showing the end of the
video.
The worksheet
for this lesson (pdf) is here
lesson plan originally found at http://www.beaconlearningcenter.com/Lessons/982.htm
|